objective Ques (84 results)
SSC CGL 20201)60 students participated in one or more of the three competitions, i.e., Quiz, Extempore and Debate. A total of 22 students participated either in Quiz only or in Extempore only . 4 students participated in all three competitions. A total of 14 students particiated in any of the two competitions only. How many students participated in Debate only ?
20
a+c = 22 ; e=4; b+d+f= 14 ; now, g = 60-(a+b+e+b+d+f) = 60 - (22+4+14) = 20

SSC CGL 20202)Which of the following Venn diagrams best represents the relationship between the classes ?
Tables, Wooden objects, Chairs.
A) B)
B) C)
C) D)
D)
.

SSC CGL 20203)Which of the following Venn diagrams best represents the relationship between the following classes?
Lady Constables, Uncles, MothersA) B)
B) C)
C) D)
D)
.
SSC CGL 20204)Which of the following Venn diagrams best represents the relationship between the following classes?
Utensils, Spoons, Steel itemsA) B)
B) C)
C) D)
D)
.
some spoons anf utensils may be steel items and vice versa. Spoons are utensils.
5)In the given Venn diagram, the ‘rectangle’ represents ‘ladies of a club’, the ‘triangle’ represents ‘like to dance’, the‘circle’ represents ‘like to sing’ and the ‘pentagon’represents ‘like to mimic’. The numbers given in the diagram represent the number of persons in that particular category.
How many ladies of the club NEITHER like to dance NOR like to mimic?
SSC CGL 2020
64
SSC CGL 20206)Which of the following Venn diagrams best represents the relationship between the following classes?
Accountants, Girls, Internet usersA) B)
B) C)
C) D)
D)
.
Some accountants may be girls and vice-versa. Some accountants may be internet users and vice-versa. Some girls may be internet users and vice-versa. Some accountants who are girls may be internet users.
7)The given Venn diagram represents results of a class of students:
The triangle represents students who scored 85% and above in Maths, the circle represents students who scored 85% and above in English, the rectangle represents students who scored 85% and above in Science, and the square represents students who scored 85% and above in Social Sciences. The numbers given in the diagram represent the number of students in that particular category.How many students scored 85% and above in all the subjects?
SSC CGL 2020
5
The number of students who scored 85% and above in all the subjects can be represented by the number present all the four geometrical figures. Such number is '5'.
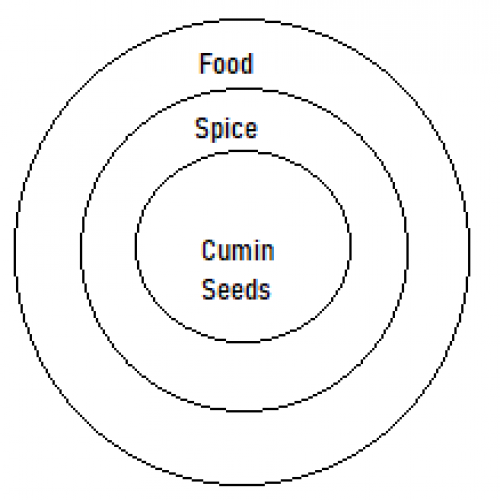
SSC CGL 20208)Which of the following Venn diagrams best represents the relationship between the following classes?
Spices, Cumin Seeds, FoodA) B)
B) C)
C) D)
D)
.
Cumin seed is a spice. Spices are food items.
9)Which of the following sets is best represented by the given Venn diagram.
SSC CGL 2020
Weeks,Years,Months
4 weeks constitute a month and 12 months constitute a year.
10)In the given Venn diagram, the ‘rectangle’ represents ‘travellers who like to travel by plane’, the ‘circle’ represents ‘travellers who like to travel by bus’, and the ‘triangle’ ‘represents travellers who like to travel by train’. The numbers given in the diagram represent the number of travellers in that particular category.
How many travellers like to travel either by train or plane but NOT by bus?
SSC CGL 2020
30
Travellers who like to travel either by train or plane but NOT by bus, can be represented by the numbers present in the triangle and the rectangle but outside the circle. Such numbers are 11, 6 and 13. So Required Sum = 11 + 6 + 13 = 30